When you create a graph from GiD it’s possible to view the numerical values in a table.
To access to the table just open the Graphs window from top menu (Window->View graphs…) and go to the Options tab. There you can select the graph and click on Show table button.
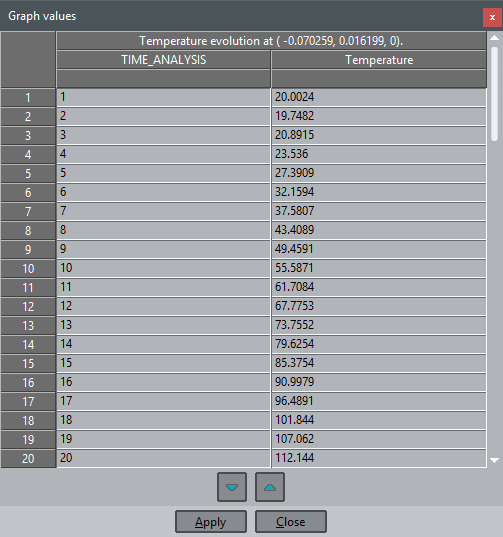
A table with the values of the graph will be shown. This table is interactive which means that the values can be updated. Just select a cell, change the value, click in Apply button and the graph will be updated. You can check the changes in the Plot graph tab of the window.
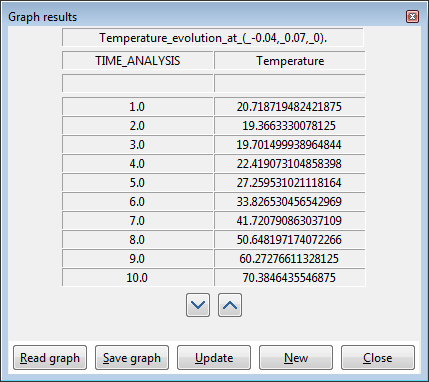
You can also add or remove rows in the table using the arrows buttons.
The values can also be copied and pasted in a spreadsheet software, for example. You only have to select them, press Ctrl-C and they will be copied to the clipboard.