Postprocessing
Several visualization options
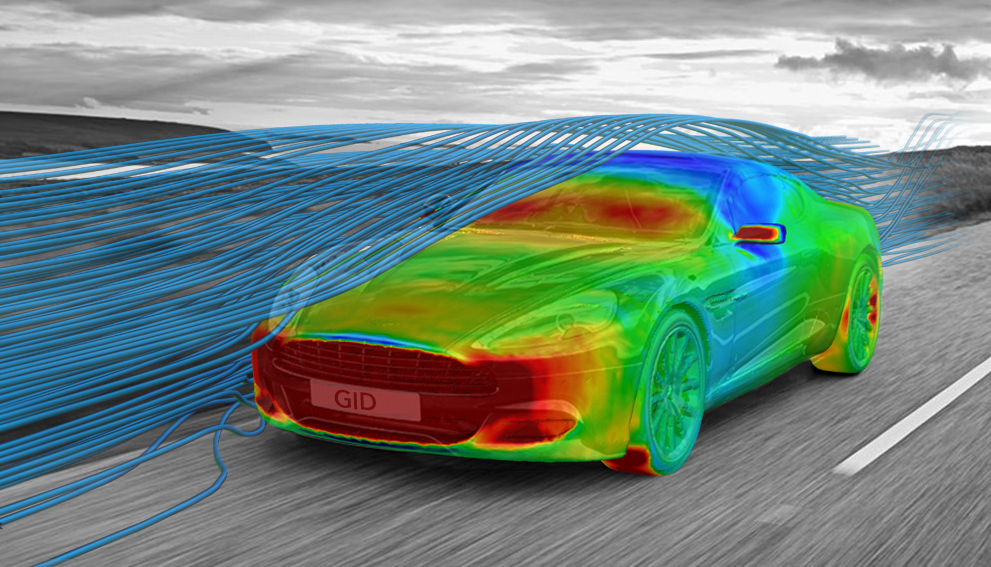
Most of the widely used analysis and visualization options for simulations’ results are included in GiD, supporting real and complex numbers. Some examples are contour fill, contour lines, vector plots, isosurfaces, beam diagrams, streamline, ribbons, node tracking, surface extrusions, model deformations, etc.
Each visualization option can be applied either to the original mesh, to an isosurface or to a cut of the mesh. Several visualization options can be applied together at the same time.
GiD also offers the possibility of visualizing and animating the results on several meshes, combining different visualization styles and results.
Animations & snapshots
GiD rendered images can be exported in several formats, as well as animations of models or results (also in stereoscopic mode), controlling their resolution. Users can take advantage of advanced external editing tools to create spectacular videos.
Cuts and isosurfaces
Additional surface meshes are generated by GiD for cuts and isosurfaces visualization, and any visualization option of a result can be applied to them. Planar or spherical cuts can be done to visualize the inner parts of the model, and they can follow the deformation of the model.
Import & export
GiD can read simulation result files written in several common formats, such as VTK, TECPLOT or FEMAP. Furthermore, the solver can directly write the results in GiD format using the GiDPost library (provided at no additional cost) to help developers in the adaptation task. GiD native formats are GiD-ASCII, GiD-binary or HDF5-binary. A plug-in mechanism allows other formats to be incorporated into GiD by users or third parties.
Meshes and results can be exported in VTK, VRML, KML and other formats.
Graphs
2D graphs can be plotted with GiD based on the 3D results, allowing the management of different graphs thanks to a user-friendly window. Some examples are: evolution of a result in a point across different time steps (point evolution), line graph, boundary graph and point analysis (a result at a point plotted against another one) and 2D polygonals.
Both cartesian and polar coordinate systems are supported. A logarithmic scale can be set for the axes too. Graphs can also be imported or exported in ASCII format or edited directly in a table.
Handling of large sets of results
Advanced visualization tools, together with the efficient management of data, provide GiD with the capability of visualizing large models with large results files in a fast and user-friendly way.
A memory-cache based system allows handling very large postprocessing files, independently on the physical memory available. Advanced mesh simplification algorithms are used for visualizing huge meshes with results, providing a real-time interaction by the user when managing the model.
Isogeometric analysis (IGA) support
All the extensive visualization and postprocessing tools of GiD are also available for NURBS geometries.
Get access to the complete graphical postprocessing system of GiD just writing a text file, giving the scalar, vector or matrix result on control points of the NURBS.
GiD generates automatically a visualization mesh for visualizing the results: contour fill, vector plots, surface extrusions, model deformations, graphs and animations, etc. Visualization mesh considers geometry details, curvatures, and results gradients.
We are providing the GiDpost library for writing the results in ASCII and binary format.
Advanced visualization tools
- Stereoscopic view: a model can be managed interactively in 3D, and stereoscopic snapshots and animations can be generated.
- Shadows: providing a better depth perception of the 3D model and a more realistic rendering.
- Environment reflection: an environment can be defined to be reflected on the model, useful to detect surface imperfections.
- Mirror and floor effects: a virtual floor can be defined to be used as a mirror, or to project the shadow of the model onto it.